
 Product
 Brand
Brand Articles
 Tools
Tools
Top 10 Popular Semiconductor Companies in 2026
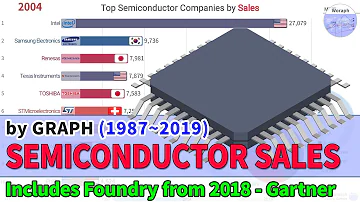
Top Semiconductor Companies Sales Ranking History (1987~2019)
Quick answer
The latest defensible top-ten list available in 2026 is based on 2025 worldwide semiconductor vendor revenue. Gartner's preliminary ranking, published in January 2026, places NVIDIA first, followed by Samsung Electronics, SK hynix, Intel, Micron Technology, Qualcomm, Broadcom, AMD, Apple, and MediaTek.
This is a 2026 article using the latest completed full-year market data. It is not a ranking of unfinished 2026 revenue. Gartner estimates semiconductor vendor revenue on a common calendar-year market basis, so its figures can differ from each company's GAAP revenue, fiscal-year dates, and segment reporting. The Gartner figures determine the order below; official company reports are used to explain products and business mix.
Ranking method and limitations
The list follows Gartner's Top 10 Semiconductor Vendors by Revenue, Worldwide, 2025. Gartner estimated total 2025 semiconductor revenue of $793.449 billion, up 21.0% from 2024. The ten ranked vendors represented 62.4% of that market.
The ranking should not be combined with company financial statements as though the numbers were identical. Gartner uses a consistent semiconductor-market methodology and calendar-year estimate. Corporate reports may use a different fiscal calendar and may include software, licensing, systems, appliances, services, or internal transactions. For example, NVIDIA's official fiscal 2026 company revenue was $215.938 billion, while Gartner estimated $125.703 billion of 2025 semiconductor vendor revenue.
The table is also not a universal list of every semiconductor business model. TSMC does not appear in this specific vendor table; foundry companies are commonly analyzed through separate foundry-market rankings. Apple appears even though it does not report a standalone merchant-chip segment. These boundaries are part of the ranking, not errors to be repaired with unrelated company revenue.
2026 top 10 semiconductor vendor ranking
| 2025 rank | 2024 rank | Vendor | 2025 semiconductor revenue | 2025 market share | Year-over-year growth |
|---|---|---|---|---|---|
| 1 | 1 | NVIDIA | $125.703 billion | 15.8% | 63.9% |
| 2 | 2 | Samsung Electronics | $72.544 billion | 9.1% | 10.4% |
| 3 | 4 | SK hynix | $60.640 billion | 7.6% | 37.2% |
| 4 | 3 | Intel | $47.883 billion | 6.0% | -3.9% |
| 5 | 7 | Micron Technology | $41.487 billion | 5.2% | 50.2% |
| 6 | 5 | Qualcomm | $37.046 billion | 4.7% | 12.3% |
| 7 | 6 | Broadcom | $34.279 billion | 4.3% | 23.3% |
| 8 | 8 | AMD | $32.484 billion | 4.1% | 34.6% |
| 9 | 9 | Apple | $24.596 billion | 3.1% | 19.9% |
| 10 | 10 | MediaTek | $18.472 billion | 2.3% | 15.9% |
Source: Gartner, January 2026. Figures are preliminary estimates in millions of US dollars in the original table. Percentages and growth rates are Gartner's market estimates, not values recalculated from the companies' fiscal reports.
What changed from 2024?
Five vendors changed position. SK hynix moved from fourth to third, passing Intel. Micron rose from seventh to fifth after Gartner estimated 50.2% semiconductor revenue growth. Qualcomm moved from fifth to sixth and Broadcom from sixth to seventh. NVIDIA, Samsung, AMD, Apple, and MediaTek held their previous positions.
The movement was concentrated around AI processors and memory. Gartner stated that AI semiconductors, including processors, HBM, and networking components, accounted for nearly one-third of 2025 semiconductor sales. NVIDIA extended its lead, while SK hynix and Micron benefited from stronger memory demand. Intel was the only top-ten vendor in the table with declining estimated semiconductor revenue.
How the business models differ
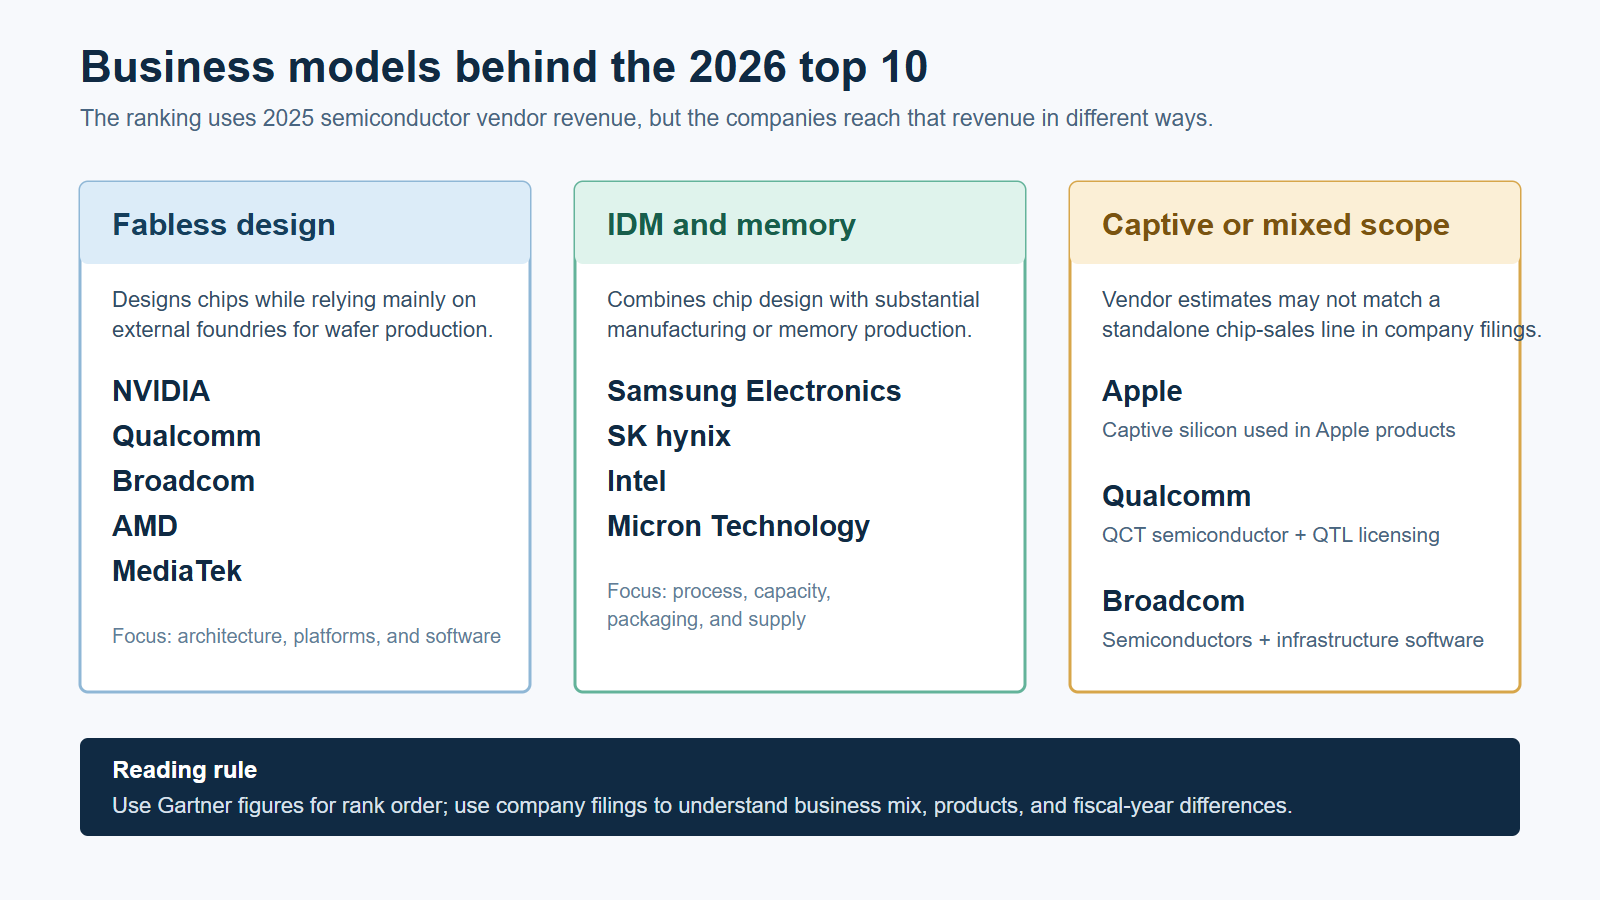
Rank order does not mean the vendors are interchangeable. NVIDIA, Qualcomm, Broadcom, AMD, and MediaTek primarily design chips and use external foundries. Samsung, SK hynix, Intel, and Micron own substantial manufacturing operations. Apple designs captive silicon for its own products rather than selling a broad merchant-chip catalog.
1. NVIDIA

Gartner 2025 semiconductor revenue: $125.703 billion
Market share: 15.8%
Growth: 63.9%
Business model: Fabless accelerated-computing platform company.
NVIDIA led the ranking for a second year and widened its advantage over Samsung. Gartner attributed more than 35% of total industry growth to NVIDIA and identified AI processors as a major driver. The company's semiconductor portfolio is closely connected to data center networking, systems, libraries, and software, so its position reflects a platform rather than a discrete GPU catalog alone.
NVIDIA's official fiscal 2026 company revenue was $215.938 billion for the year ended January 25, 2026. Full-year Data Center revenue was $193.7 billion. These larger corporate values cover systems, networking, and platform activity under NVIDIA's accounting and fiscal calendar; they should not replace Gartner's $125.703 billion value inside this ranking.
Engineers comparing accelerators should evaluate application performance, memory capacity and bandwidth, interconnect, power and cooling, deployment form factor, software portability, library support, and total system cost. Peak arithmetic throughput alone does not predict workload performance.
2. Samsung Electronics

Gartner 2025 semiconductor revenue: $72.544 billion
Market share: 9.1%
Growth: 10.4%
Business model: Memory IDM, logic supplier, and foundry within Samsung Electronics.
Samsung retained second place. Gartner reported that memory revenue grew while non-memory revenue declined. Samsung's Device Solutions division contains Memory, System LSI, and Foundry businesses, so the company participates in DRAM, NAND, HBM, logic, image sensors, and contract manufacturing.
Samsung's official 2025 Facts and Figures page reports KRW 130.1 trillion in DS division net sales and KRW 333.6 trillion in consolidated Samsung Electronics sales. The larger company total includes consumer devices, appliances, displays, and other operations. Neither figure is a direct substitute for Gartner's calendar-year semiconductor-market estimate.
A memory buyer should compare density, interface generation, qualification, and supply commitments. A foundry customer should compare process design kits, node characteristics, intellectual property, packaging, yield, and manufacturing agreements. Those are different decisions even though both sit within the DS division.
3. SK hynix

Gartner 2025 semiconductor revenue: $60.640 billion
Market share: 7.6%
Growth: 37.2%
Business model: Memory integrated device manufacturer.
SK hynix moved from fourth to third. Gartner connected the rise with HBM demand in AI servers. The company's portfolio also includes conventional DRAM, NAND flash, and solid-state storage for servers, PCs, mobile devices, and other systems.
For calendar 2025, SK hynix officially reported KRW 97.1467 trillion in revenue and KRW 47.2063 trillion in operating profit. The company attributed its record results to AI-memory competitiveness and higher-value products including HBM. Gartner's dollar estimate remains the correct value for comparison inside the ranking.
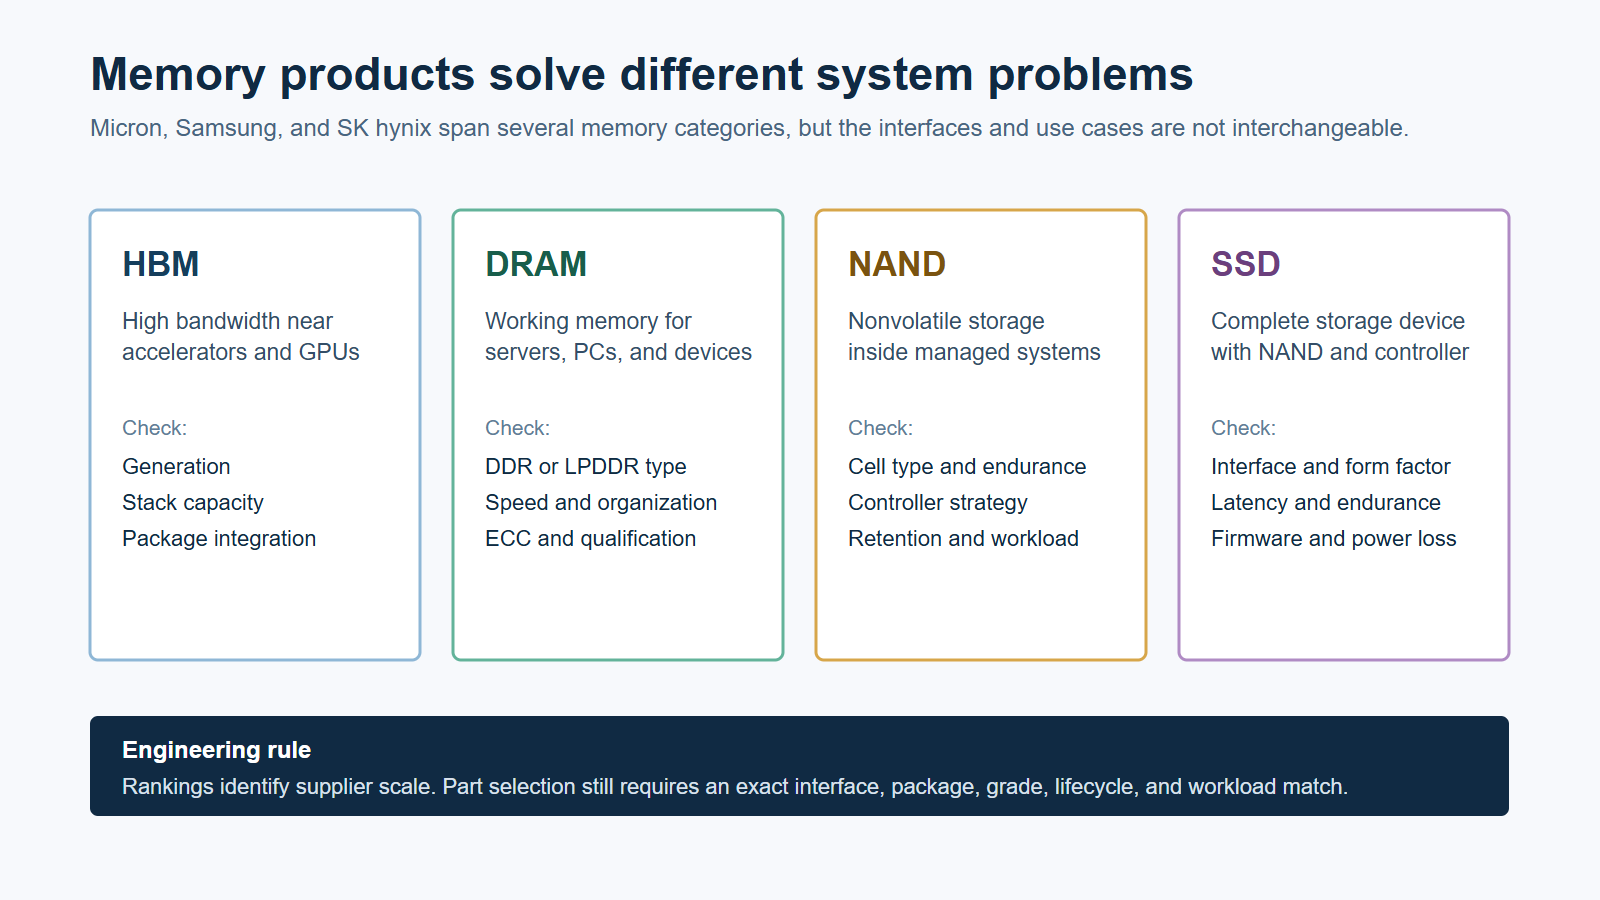
Memory selection requires an exact density, organization, speed grade, voltage, package, temperature range, controller relationship, error-correction requirement, qualification status, and supply plan. HBM, commodity DRAM, managed NAND, and discrete NAND solve different problems.
4. Intel

Gartner 2025 semiconductor revenue: $47.883 billion
Market share: 6.0%
Growth: -3.9%
Business model: Integrated device manufacturer with product and foundry operations.
Intel moved from third to fourth and was the only top-ten vendor with declining estimated revenue. It remains important in client and server computing through Core, Xeon, and related platforms, while its manufacturing and packaging operations support internal products and an external foundry strategy.
Intel's official consolidated revenue was $52.853 billion for the year ended December 27, 2025. Intel Products generated $49.147 billion and Intel Foundry reported $17.826 billion, but the segments cannot be added: the annual report records $17.683 billion of intersegment eliminations.
For system selection, compare instruction set, workload performance, performance per watt, memory and I/O support, platform lifecycle, software compatibility, security features, and board ecosystem. Vendor rank does not establish processor suitability.
5. Micron Technology

Gartner 2025 semiconductor revenue: $41.487 billion
Market share: 5.2%
Growth: 50.2%
Business model: Memory and storage integrated device manufacturer.
Micron made the largest upward move in the table, rising from seventh to fifth. Its portfolio includes DRAM, HBM, NAND flash, managed memory, and SSD products for data center, client, mobile, automotive, industrial, and consumer applications.
Micron's fiscal 2025 ended on August 28, 2025. The company officially reported revenue of approximately $37.4 billion, up nearly 50% from the previous year, and said combined HBM, high-capacity DIMM, and low-power server DRAM revenue reached $10 billion. Gartner's $41.487 billion is a calendar-year market estimate, which explains why it is not identical to Micron's fiscal total.
6. Qualcomm

Gartner 2025 semiconductor revenue: $37.046 billion
Market share: 4.7%
Growth: 12.3%
Business model: Fabless semiconductor products plus technology licensing.
Qualcomm moved from fifth to sixth even though Gartner estimated double-digit growth. QCT develops Snapdragon and Qualcomm Dragonwing platforms, modems, connectivity, automotive, IoT, PC, and RF front-end products. QTL licenses portions of the company's intellectual-property portfolio.
Qualcomm reported $44.3 billion in GAAP company revenue for the fiscal year ended September 28, 2025. Its corporate reporting identifies approximately $38.4 billion from QCT and $5.6 billion from QTL. Gartner's $37.046 billion vendor figure is closer to semiconductor scope but still follows Gartner's calendar-year methodology.
Evaluation should include the exact platform configuration, operating-system support, regional modem requirements, radio certification, long-term software maintenance, power-management design, and access to documentation.
7. Broadcom

Gartner 2025 semiconductor revenue: $34.279 billion
Market share: 4.3%
Growth: 23.3%
Business model: Fabless semiconductor solutions within a semiconductor and infrastructure software company.
Broadcom moved from sixth to seventh despite strong estimated growth. Its semiconductor products span networking, broadband, wireless, storage connectivity, and industrial markets. The company also owns a large infrastructure software business, so total company revenue is not chip revenue.
For the fiscal year ended November 2, 2025, Broadcom reported $63.887 billion in total net revenue. Semiconductor solutions contributed $36.858 billion and infrastructure software contributed $27.029 billion. The semiconductor segment provides useful corporate context, while Gartner's $34.279 billion controls the rank.
Product qualification can depend on reference designs, firmware, high-speed signal integrity, optical or electrical interface requirements, security features, packaging, and long-term platform relationships.
8. AMD

Gartner 2025 semiconductor revenue: $32.484 billion
Market share: 4.1%
Growth: 34.6%
Business model: Fabless semiconductor company.
AMD held eighth place while Gartner estimated 34.6% growth. Its major families include EPYC server processors, Ryzen client processors, Radeon graphics, Instinct accelerators, and adaptive and embedded products derived from its Xilinx portfolio.
AMD officially reported $34.639 billion in revenue for the year ended December 27, 2025. Data Center contributed $16.635 billion, Client and Gaming contributed $14.550 billion, and Embedded contributed $3.454 billion. The company report explains its business mix, while the Gartner estimate determines market rank.
Practical comparison should cover CPU and platform compatibility, accelerator software, memory and I/O topology, power envelope, board availability, virtualization, security features, tools, and lifecycle.
9. Apple

Gartner 2025 semiconductor revenue: $24.596 billion
Market share: 3.1%
Growth: 19.9%
Business model: Captive semiconductor design for Apple products.
Apple retained ninth place in Gartner's table. It is different from the merchant suppliers around it: Apple designs processors, connectivity chips, and other silicon primarily for use inside its own devices. Apple does not publish a standalone semiconductor revenue segment, so the $24.596 billion value should be treated as Gartner's market estimate rather than Apple-reported chip sales.
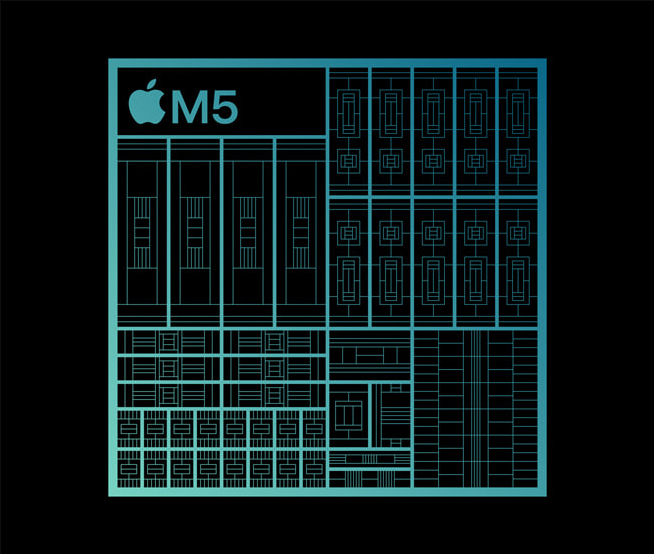
Apple's official 2025 product materials show the breadth of its silicon work. The M5 system on a chip combines CPU, GPU, Neural Engine, media, and unified-memory functions for Mac, iPad, and Vision Pro products. Apple also stated that its US silicon supply chain was on track to produce more than 19 billion chips for Apple products in 2025.
10. MediaTek

Gartner 2025 semiconductor revenue: $18.472 billion
Market share: 2.3%
Growth: 15.9%
Business model: Fabless semiconductor company.
MediaTek retained tenth place. Its portfolio covers mobile SoCs, Wi-Fi and broadband connectivity, television and smart-home chips, automotive products, and edge applications. Dimensity is its prominent mobile platform family, but the company serves more than smartphones.
For the year ended December 31, 2025, MediaTek officially reported consolidated revenue of NT$595.966 billion, up 12.3%. The difference from Gartner's 15.9% estimate reflects currency and market-method differences. The values should be kept in their original contexts.
Product comparison should include CPU and accelerator configuration, modem and connectivity support, multimedia interfaces, power-management requirements, software stack, board support, documentation access, and product lifecycle.
How to read the ranking
Use one dataset for order
Do not rank some vendors by Gartner semiconductor revenue, others by company revenue, and others by segment revenue. This article uses Gartner for all ten positions. Official financial statements add context without changing the order.
Keep estimates separate from audited reports
Gartner's table is preliminary market research. Company annual reports are formal financial disclosures under each company's accounting and fiscal calendar. A difference between the two does not automatically mean either number is wrong.
Separate vendor rankings from foundry rankings
A vendor table and a foundry table answer different questions. TSMC's absence does not imply that it is smaller or less important. It means this particular Gartner table should not be expanded with a number from another market definition.
Do not confuse rank with engineering fit
Revenue indicates market scale. It does not validate a device's voltage limits, package, interface, software, reliability, supply status, or lifecycle for a specific design.
Engineering and sourcing checklist
Define the function: State the compute, memory, analog, connectivity, power, or interface requirement before choosing a supplier.
Verify the exact part: Use the current manufacturer datasheet, package drawing, errata, and ordering information.
Check lifecycle: Confirm active status, longevity statements, product-change notices, and end-of-life policy.
Review qualification: Match temperature grade, reliability standard, automotive or industrial qualification, and functional-safety needs.
Evaluate the ecosystem: Include development boards, compilers, operating systems, drivers, libraries, reference designs, and technical support.
Plan supply: Confirm authorized sourcing, lead time, minimum order quantity, allocation risk, and second-source strategy.
Validate compatibility: Do not describe another part as a direct replacement until pinout, electrical limits, timing, firmware, package, and qualification have been checked.
Utmel's semiconductor articles, server CPU overview, and semiconductor storage guide provide additional background.
Frequently asked questions
Are these 2026 semiconductor revenue figures?
No. Full-year 2026 is not complete. This 2026 edition uses the latest completed worldwide ranking, Gartner's preliminary 2025 semiconductor vendor revenue table published in January 2026.
Why did the company list change?
The old article used an undefined selection. The refreshed article now follows one published ranking. Micron and Apple enter the article because Gartner ranked them fifth and ninth. HiSilicon and Texas Instruments are not in Gartner's 2025 top ten.
Why is TSMC not in the top ten?
TSMC is not present in this specific Gartner semiconductor vendor table. Pure-play foundries are commonly compared through separate foundry rankings. Adding TSMC revenue to this table would mix methodologies.
Why is Apple included?
Gartner includes Apple at number nine. Apple designs substantial captive silicon for its own products but does not report a standalone merchant-chip segment. Its $24.596 billion value is therefore a Gartner estimate, not Apple-reported chip revenue.
Why do Gartner and company revenue figures differ?
Gartner estimates calendar-year semiconductor vendor revenue. Company figures may use different fiscal dates and include software, licensing, systems, devices, services, or internal transactions. The two datasets have different purposes.
Which companies moved the most?
Micron rose two places, from seventh to fifth. SK hynix rose from fourth to third. Intel, Qualcomm, and Broadcom each moved down one place. The other five vendors held their 2024 positions.
Does number one mean the best semiconductor supplier?
No. Rank measures estimated revenue under Gartner's methodology. Technical suitability depends on the exact component, specifications, quality system, lifecycle, ecosystem, supply, support, and total design cost.
Official sources used for this update
 UTMEL
UTMEL
We are the professional distributor of electronic components, providing a large variety of products to save you a lot of time, effort, and cost with our efficient self-customized service. careful order preparation fast delivery service
 Modeling Wide Band-Gap Semiconductors for Enhanced PerformanceRakesh Kumar, Ph.D.31 January 20243797
The article delves into the challenges faced by silicon-based power electronic devices and highlights the potential of wide band-gap semiconductors. It also emphasizes the importance of modeling power semiconductor devices and provides insights into various models. For electrical energy conversion to be dependable and effective, power electronics and semiconductor device technologies are essential.
Read More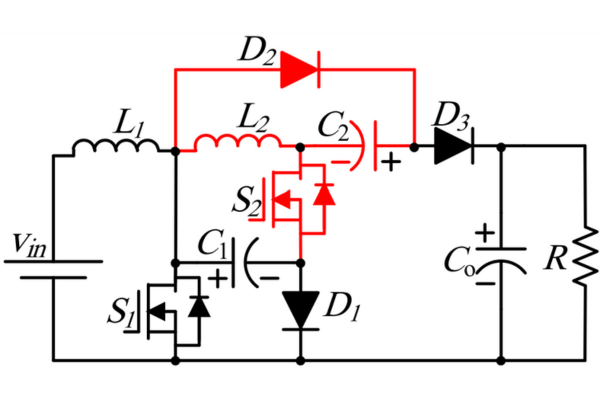 Optimizing Energy Management with Non-Isolated DC-DC ConvertersRakesh Kumar, Ph.D.04 February 20243445
The article classifies DC-DC converters and discusses the benefits and limitations of them. It proposes a modified DC-DC converter topology that combines the Cuk and Positive Output Super Lift Luo topologies to achieve a higher voltage gain with fewer components.
Read More ‘6G Networks’ - Pioneering the Next Era of Connectivity And InnovationRakesh Kumar, Ph.D.18 March 20243767
The article provides a comprehensive overview of the evolving landscape of mobile networks, the requirements that will shape the future of mobile communication, and the innovative technologies driving the transition to 6G.
Read More Review of IoT-Based Smart Home Security Systems- Part 1Rakesh Kumar, Ph.D.28 March 20244245
The article discusses the evolution of IoT-based smart home security systems, integrating advanced technologies like Raspberry Pi, PIR sensors, and voice recognition for enhanced user experience and efficiency.
Read More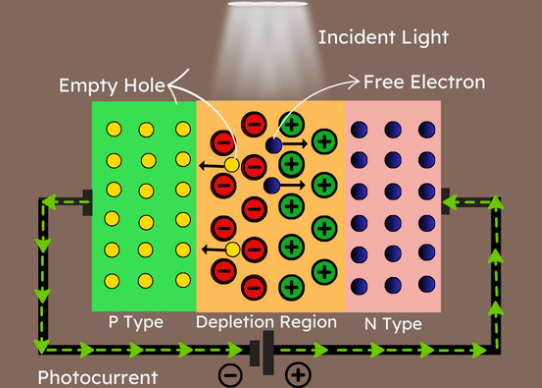 Understanding Photodiodes: Working Principles and Applications - Part 2Rakesh Kumar, Ph.D.24 May 20245465
The article provides a comprehensive overview of photodiodes, focusing on their operational principles, key factors affecting their efficiency, advantages, and disadvantages, and highlights their diverse applications.
Read More
Subscribe to Utmel !